
Why Tracking CAC, LTV, and Profit is the Foundational Upgrade Shopify Brands Need
LTV is simply the total profit a customer generates over time, but most brands misunderstand it. In 2026, the e-commerce industry has shifted toward a profit-first model where top-line revenue no longer guarantees survival. To build a business that actually holds, you need to understand the economics supporting it.
-
Learn why growing sales can lead to growing into bankruptcy.
Understand why the LTV to CAC gold standard is your baseline for survival.
See how small gains in loyalty drive exponential profit compared to new acquisitions.
The Revenue Trap: Why Most Shopify Stores Struggle Despite Growing Sales
Sales growth can be misleading, and for many brands, it’s where things start to break. According to a 2026 analysis, about 70% of ecommerce businesses fail in their first year, with only ~10% of new Shopify stores still active after 90 days and an annual merchant churn rate of 28%. This revenue trap happens when high top-line numbers mask negative contribution margins on an order-by-order basis.
Many brands fall into the habit of growing into bankruptcy by scaling based on total sales without accounting for COGS and shipping. We’ve seen this firsthand in B2B SEO, where fixing margin inefficiencies changed how the business scaled.
Shifting the Lens from Surface Metrics to Profit-First Analytics
Most brands are measuring the wrong things. Here’s how strong Shopify brands actually evaluate performance:
Defining the LTV to CAC Gold Standard for Sustainable DTC Success
What matters is how much you pay to acquire a customer versus what they’re worth. Experts at Recharge recommend an LTV:CAC of at least 3:1 for ecommerce businesses, reinforcing this as the floor for sustainable growth.
While specific benchmarks vary (e.g., beauty and food often require higher ratios due to lower margins, while apparel can sometimes lean on higher order values), any ratio under 2:1 signals a fragile business model. If your LTV doesn’t significantly outpace your acquisition costs, your brand is essentially on borrowed time.
Moving Beyond ROAS to Marketing Efficiency Ratio and First-Order Profitability
While platform-reported ROAS is a popular metric, it is often clouded by attribution noise. High-volume brands are shifting toward Marketing Efficiency Ratio (MER), which divides total revenue by total ad spend to see the entire picture.
If a customer isn’t profitable on the first purchase, your margin is already under pressure. For more on this, check out our checklist on how to standardize data for multi-channel campaigns.
The Critical Difference Between Revenue-Based LTV and Margin-Adjusted LTV
Many merchants fall into the trap of calculating CLTV vs. LTV using top-line revenue, which is a vanity exercise that overestimates how your brand is actually doing. To see what’s really happening, you need Margin LTV, which focuses on Gross Profit after all variable costs are subtracted.
Applying gross margin to your calculations often reveals a sobering reality: a healthy-looking 8:1 revenue-based ratio could actually be a much tighter 4:1 margin-based reality. Margin-adjusted LTV is the only metric that reflects the actual bankable value you can use to reinvest in your business.
The Privacy-First Reality: Why Retention is Your Greatest Competitive Advantage
In a post-iOS world, the cost of finding new customers has skyrocketed. Survival now depends on shifting from acquisition to retention.
Navigating Rising Acquisition Costs and Post-Privacy Ad Platform Inflation
The digital landscape changed forever following iOS 14.5, which severely limited data tracking and attribution. A 2022 analysis of customer acquisition costs after iOS 14.5 notes a sharp rise in CPMs; one dataset on over 100M in annual spend showed an 80% year-over-year increase in CPMs, contributing directly to higher CAC. This reduced identifier access forced brands away from precise low-funnel targeting toward more expensive awareness plays.
When you combine an 80% CPM jump with a 40% rise in CAC over just two years, one-and-done customer acquisition becomes a mathematical impossibility for most brands. You simply cannot spend your way out of a high churn rate in this environment. To understand how to navigate these changing search and ad landscapes, see our guide on surviving AI overviews.
The Retention Multiplier: How Small Gains in Loyalty Drive Exponential Profit
Retention is what makes rising acquisition costs survivable. According to recent data, increasing customer retention rates by 5% increases profits by 25% to 95%. This massive jump is because of the efficiency gap: there is a 60-70% probability of selling to an existing customer, compared to just 5-20% for new prospects.
When you support retention with the right follow-up strategy, a single purchase turns into long-term value.
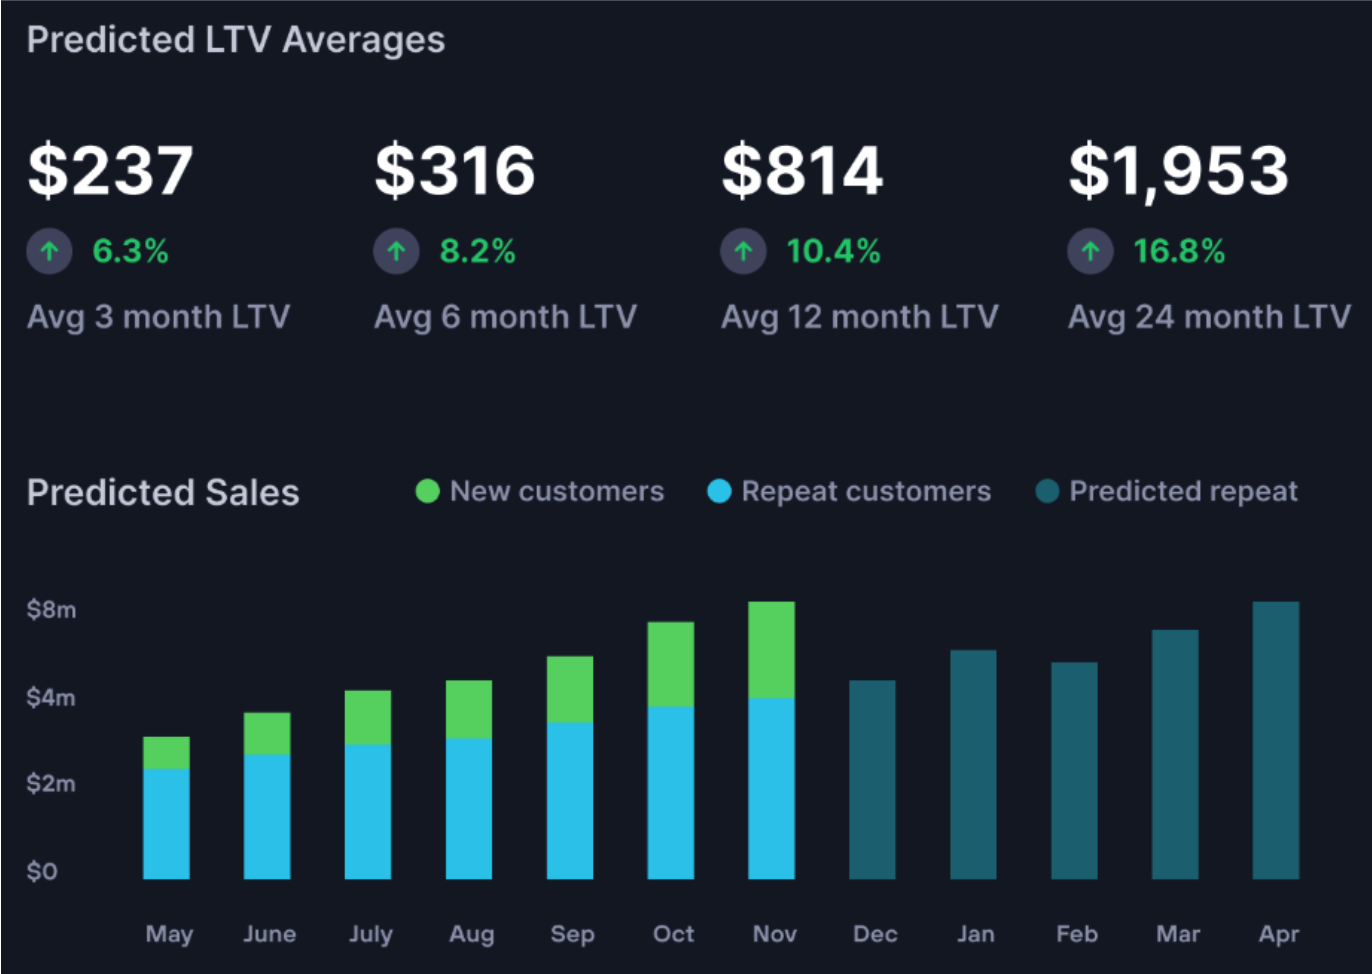
Operationalizing True Profitability with Lifetimely by AMP
Knowing your numbers isn’t enough; you need to act on them. High-growth brands don’t calculate this manually.
Bridging the Gap with Shopify and Amazon Multi-Channel Reporting
For high-volume merchants, fragmented data across different sales platforms is a major hurdle to understanding actual brand-wide performance. Lifetimely’s 2023 announcement for its Amazon integration states that merchants can track P&L metrics for multiple Shopify and Amazon stores on one platform and get true multi-channel visibility.
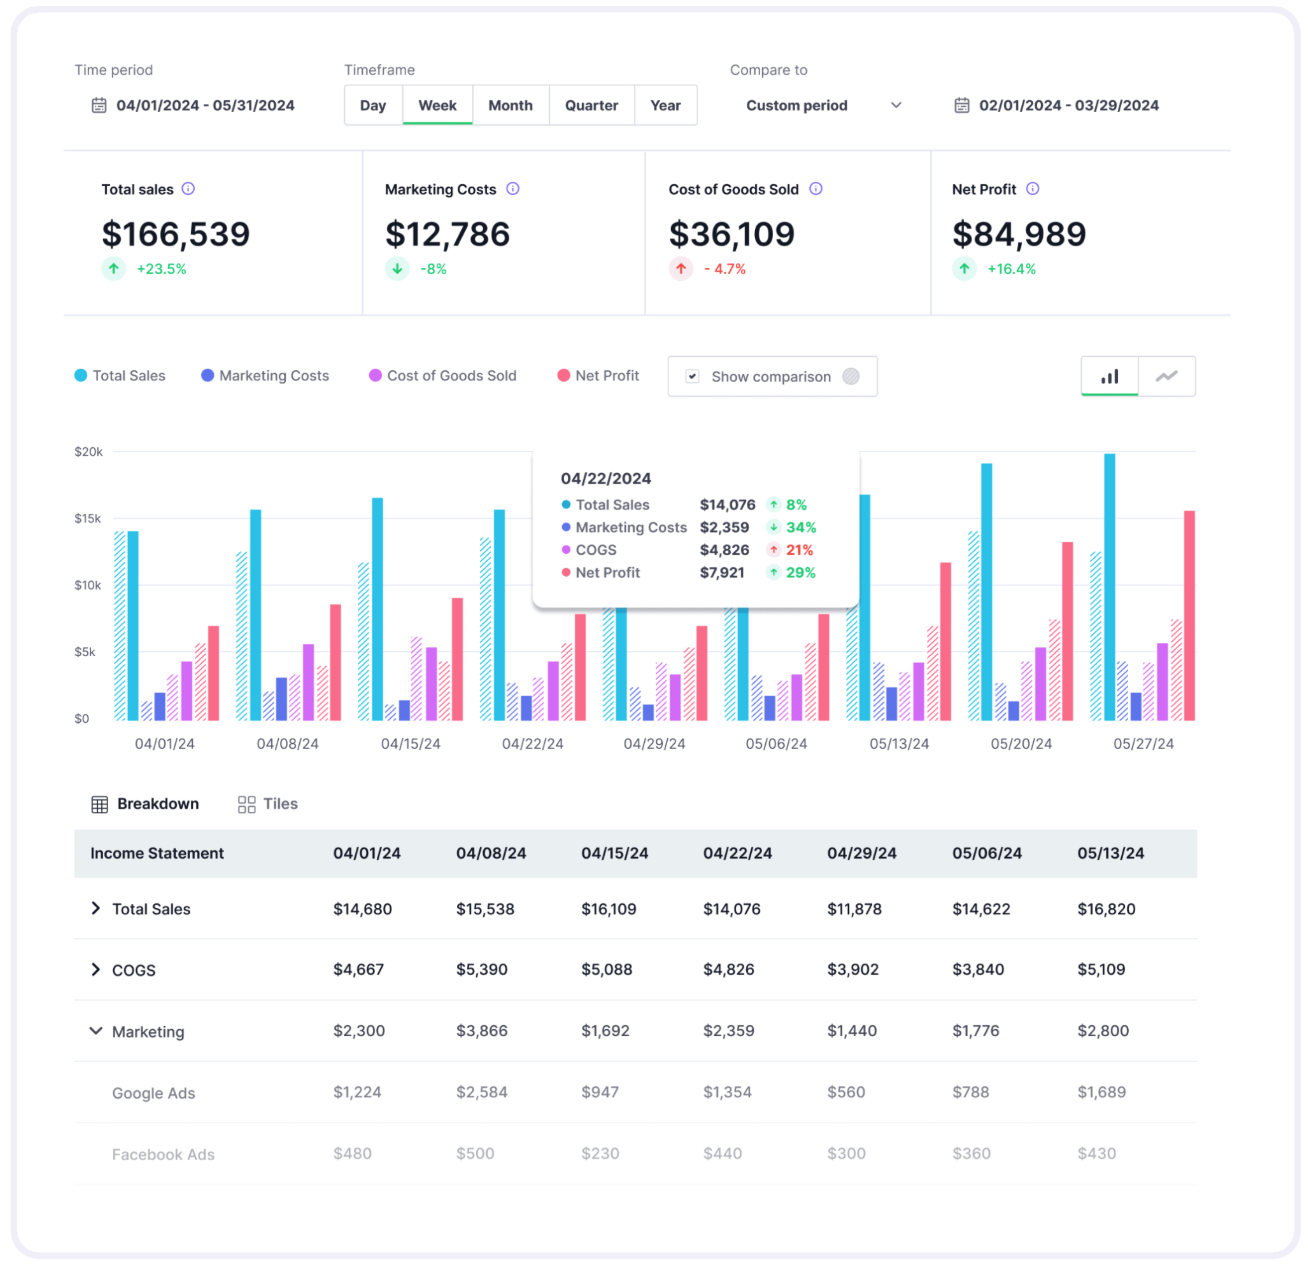
It pulls your data into one place so you can see what’s actually driving profit. When you combine Shopify and Amazon data, you can finally see true net profit without manually stitching together spreadsheets.
Leveraging Cohort Analysis and Real-Time Profit and Loss Automation
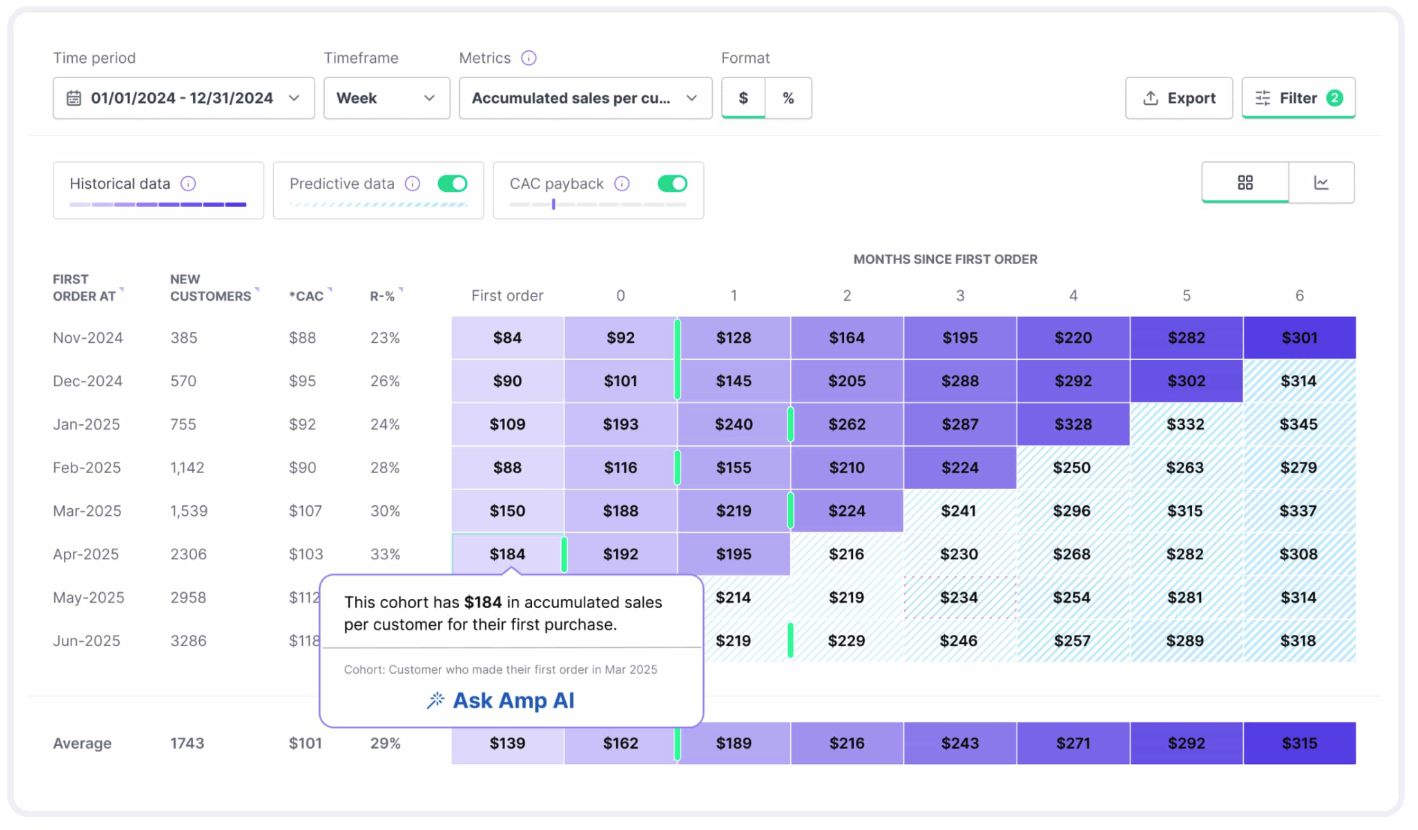
Cohort reports show which customers actually become profitable by tracking behavior based on their signup month. These reports reveal your actual payback periods, showing how long it takes each group to become profitable.
With Product Journeys, you can identify which initial purchases lead to high-value repeat buyers and which ones result in one-and-done customers. The platform automates the inclusion of COGS, shipping, and ad spend to provide a real-time, accurate income statement. Instead of stitching together spreadsheets, you can see performance in real time, allowing you to adjust your marketing spend the moment your margins shift.
The Eyeful Media Approach: Turning Data Into a Strategic Growth Engine
Data doesn’t change anything, but decisions do. Our team helps you move beyond basic reporting to execute a full digital transformation that prioritizes long-term profitability.
Case Study Snippet: Driving Growth by Cutting Waste
To escape the trap where high sales mask negative margins, brands must allow data to dictate spending. Eyeful Media applied this philosophy to a multi-channel farm supply retailer struggling with inefficient ad spend across a massive product catalog. The team focused on identifying which products actually improved the bottom line.
The Strategy:
Identify the Winners: Rather than spreading the budget thin, the team used performance data to focus exclusively on top-performing SKUs.
Optimize for Efficiency: The goal was to find the point of diminishing returns for ad sets, ensuring every dollar spent contributed to a healthy LTV:CAC ratio.
The Results:
Despite a 22% reduction in overall marketing budget, the brand saw massive gains in actual bankable value:
34% increase in revenue.
54% increase in total transactions.
115% increase in ROAS efficiency.
The Lesson for Shopify Brands: You don't always need a larger budget to scale; you need a more precise one. By using tools like Lifetimely to identify which first purchases lead to high-value repeat buyers, you can cut ad spend and pivot your budget toward audiences that offer the highest long-term ROI.
Conclusion: Best Practices and Scaling with Confidence
If your unit economics don’t work, scaling just accelerates the problem. Start by understanding your margins, your LTV:CAC, and where retention is breaking down.
Next Steps:
Factor in COGs, shipping, and returns to find your actual contribution margin.
Move beyond revenue-based LTV to see the true bankable value of your customers.
Use cohort analysis to find which first purchases lead to the highest long-term retention.
Ensure you are hitting at least a 3:1 ratio to maintain a healthy growth floor.
Implement a tool like Lifetimely to get real-time visibility into your P&L.
Frequently Asked Questions
-
Lifetimely automates the tracking of critical unit economics, including CAC, LTV, and real-time net profit. It also provides advanced cohort analysis to monitor customer behavior over time and product journeys to identify which items drive the highest repeat purchase rates.
-
The ratio between LTV and CAC determines your brand's sustainability. Without these metrics, you may scale into bankruptcy by spending more to acquire customers than they are worth, especially as rising ad costs and privacy changes compress margins.
-
The app offers one-click integration with Shopify and Amazon, along with direct links to major ad platforms like Meta, Google, and TikTok. It also pulls data from shipping tools (e.g., ShipStation) and subscription apps (e.g., Recharge) to create a comprehensive P&L.
-
No, it complements them. While Google Analytics focuses on traffic and Shopify Reports track basic sales, Lifetimely focuses on profitability and long-term customer value, providing the financial depth that native tools often lack.
-
High-volume DTC brands and multi-channel merchants (Shopify + Amazon) see the most value. It is particularly effective for brands with repeat purchase potential, such as apparel, beauty, and subscription-based businesses.
-
Setup typically takes less than 30 minutes. Once integrated, the app pulls historical data to generate your first LTV and cohort reports within 1-2 hours, providing immediate visibility into your brand's financial health.
-
Yes. Brands use Lifetimely to identify which marketing channels bring in one-and-done buyers versus loyal subscribers. Isolating these cohorts lets you pivot your budget toward the audiences that offer the highest long-term ROI.
-
While results vary, brands often see an immediate ROI by identifying and cutting bleeding ad spend. By optimizing for a 3:1 LTV:CAC ratio and boosting retention by just 5%, merchants can see profit increases ranging from 25% to 95%.
Contact Eyeful Media today to learn how our digital transformation services can help you master your unit economics and scale your Shopify brand with confidence.