Google Analytics 4 Training Tips For Understanding Your Data
Google Analytics is a commonly referenced dashboard in any digital marketing campaign. While working to help our clients better understand website data and leverage that data for strategic planning, we’re offering Google Analytics 4 audits and working sessions.
Our GA4 training sessions have helped our clients quickly understand the key differences from earlier analytics versions. We're also updating default settings in their GA4 account, adding filters, and creating dashboard views with real-time data on conversions.
Benefits of GA4 include more user data on website activities throughout the buyer journey. But you need to set your account up properly first. Below are the tips we’ve offered to help clients optimize their GA4 account to get the most out of their website data.
GA4 Training Tips
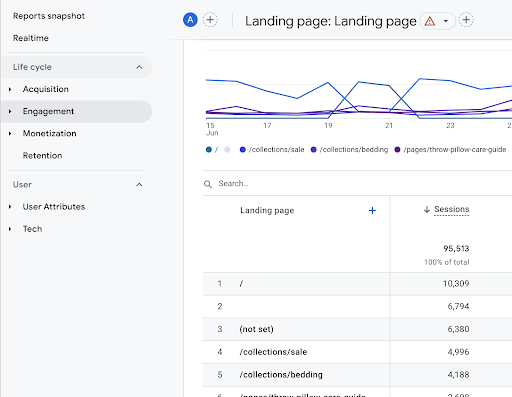
Why are there blank lines in my GA4 landing page report?
In the Landing Page report (or when using the Landing Page dimension - not inclusive of “+ Query String”) — you'll see blank lines like the one shown above on line 2.
The blank lines typically reference the homepage.
The default landing page report relies on the “landing page” dimension, which trims off query strings. Therefore a URL such as ?ga_test=yes” without a trailing slash would appear as a blank line in the report. Conversely, a URL such as “/?ga_test=yes” with a trailing slash would display as “/”.
You can almost always combine that line with the home directory's "/" data to get the homepage data (lines 2 and 6 in the screenshot above).
To determine if the blank lines in your landing page report are the homepage, you can create a custom Explore report that uses the dimension “landing page + query string” and compare the numbers with the out-of-the-box report.
What does (not set) mean in the GA4 landing page report?
When you see (not set) in the landing page report, the reason is typically due to the session expiration time frame. Think of a user who navigates to your website and gets distracted in a different tab.
Their session is still open unless it expires, and if the user later returns to that tab (not set) is logged as the landing page. You can adjust this to reduce the amount of (not set) landing page sessions.
The default session timeout is only 30 minutes, which tends to be too short. This is especially true for luxury products with a more extended consideration phase or when customers may be cross-shopping several sites (e.g., Black Friday and Cyber Monday weekend).
For most clients, we recommend adjusting the session timeout to close to the max (7 hours and 55 minutes).
How to adjust the session timeout to avoid seeing (not set) in your landing page report?
If you are seeing (not set), we recommend changing the default settings in GA4. You can adjust the session timeout to be closer to the maximum allowed in GA 4 (7 hours and 55 minutes).
You can adjust this in Settings > Data Streams > click the Data Stream > Configure Tag Settings (Under Google tag) > Show All (top right of the Settings section) > Adjust Session Timeout.
Extending the session expiration timeframe should significantly reduce the amount of (not set) landing pages in your report. However, it is essential to consider that it only affects data processed from the time of the change moving forward.
If you’ve been collecting data with a shorter session expiration window, it’s common to find sessions “drop” significantly due to the change. For example, if your window is 30 minutes and 50% of your sessions return within an eight-hour window, sessions might drop by 25% if comparing new data to the previous timeframe.
What are engaged sessions?
A new metric introduced by GA4 is "Engaged Sessions." Engaged Sessions are sessions where the user either persists on your website for longer than the “Engaged Sessions Duration” or navigates to more than one page in their session.
Universal Analytics (UA) provided a bounce rate metric. Bounce rate measured effectively the opposite of engaged sessions. This means bounce rate measured the percentage of people who did not navigate to more than one page or stay longer than a specific period. Engaged sessions count the number of sessions that did navigate to more than one page or stay longer than a specific period. GA4 does not have bounce rate as a metric.
By default, the Engaged Sessions Duration is 10 seconds — too short for the average website. We recommend increasing the duration to between 30 and 60 seconds, depending on your traffic mix.
The Engaged Sessions Duration setting is under the same screen as the Session Expiration timeframe. You can find it by navigating to Settings > Data Streams > click the Data Stream > Configure Tag Settings (Under Google tag) > Show All (top right of the Settings section) > Adjust Engaged Sessions Duration.
Engaged Sessions can be instrumental in measuring the initial effectiveness of top-of-the-funnel marketing. For example, you might launch an extensive new paid social campaign that has yet to drive significant transactions or revenue. However, a high percentage of Engaged Sessions can help you determine if the quality of traffic is the issue or if you need to better address the middle and bottom of the funnel in your campaign to drive business results.
How does combining dimensions impact data continuity?
Be careful of creating inaccurate website reports by combining dimensions not directly comparable in GA4. Each traffic source or acquisition dimension measures traffic (and subsequent conversions) differently when building custom reports and or Explore reports. Below are examples:
User acquisition report - assigns conversions and events to the first channel, source/medium, source, campaign, etc., that drove the client to the website. While not exactly “first-touch,” you can look at user acquisition this way.
Session acquisition report - assigns conversions and events to the last channel, source/medium, source, campaign, etc., that drove the client to the website. This is effectively “last-touch” attribution.
Do NOT try to combine dimensions from different categories of attribution: Combining dimensions from different categories of Traffic Source and/or Attribution under your Explore reports will adversely impact reporting metrics. For example, you don't want to have one dimension that is First Touch User Campaign with a secondary dimension of Session Source/Medium. This will significantly defect the data found in your metrics. While GA4 allows you to do this, we strongly advise against doing so.

Contact Eyeful Media to learn how we can help with reporting and analytics.